We monitor the power usage in our Introduction to Electrical Engineering Laboratory using a system from eGauge. The system collects data on the total power consumed as well as on power consumed by each bench in the lab, so that students can view the energy usage of their experiments and test equipment. You can see this data by clicking on the following links.


Power Monitoring Unit and Current Transformers
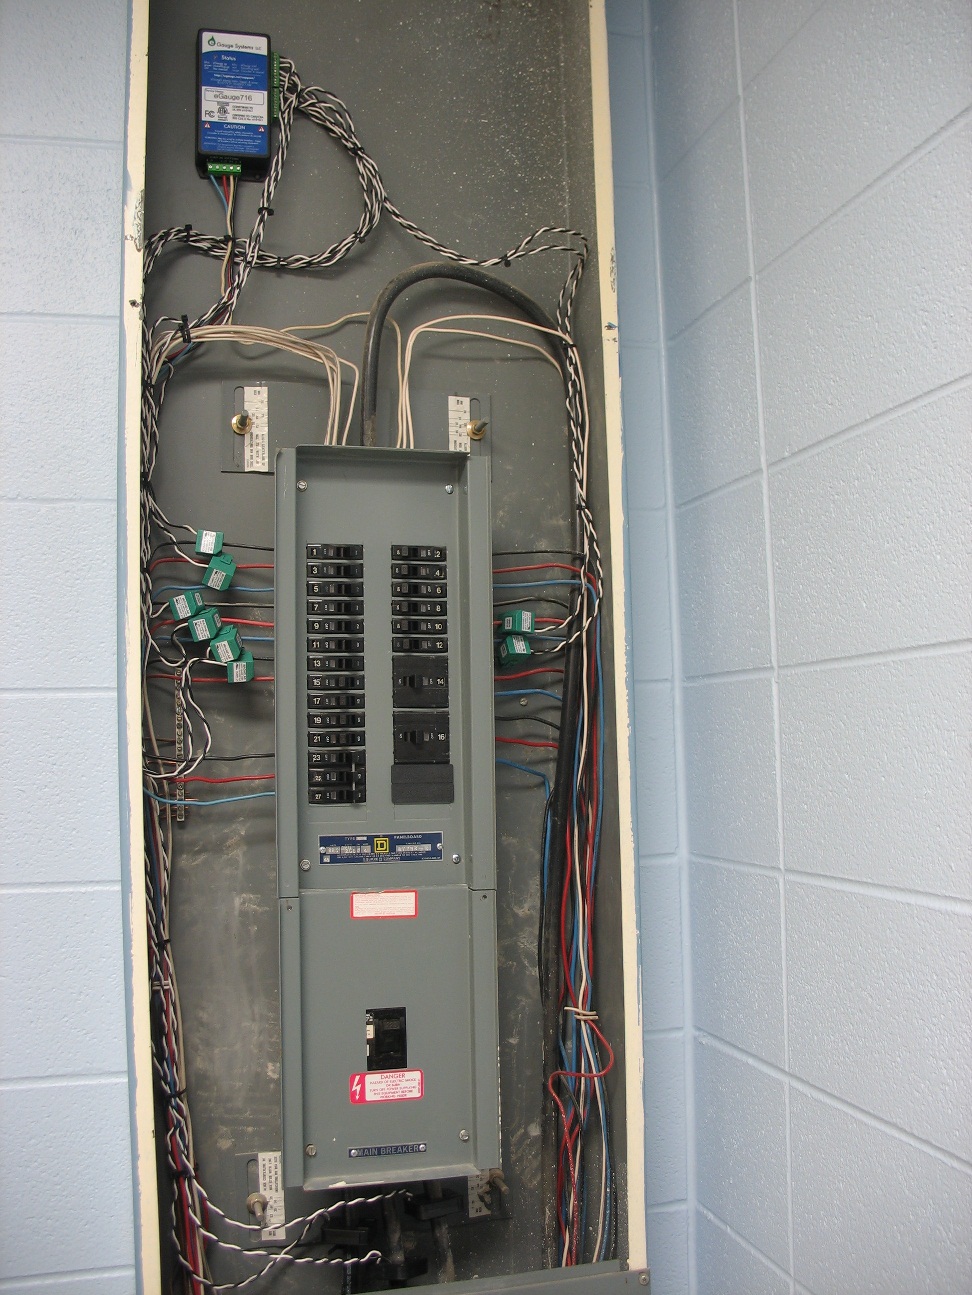
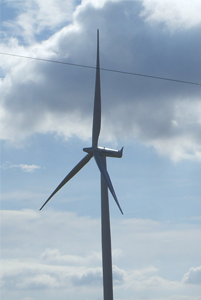
The system is installed in the breaker panel in the lab and monitors both the voltage and the current on the three phase lines entering the panel. In addition, current from each breaker supplying each bench in the lab is monitored (see small green cubes on breaker wires in photo). The eGauge webpage displays the total power by multiplying the measured currents by the associated line voltages and then summing them to provide the total usage graphs. A second graph (in green) can be used to display power generated. We will use this second graph during certain experiments in our course where we feed power back into the grid in the same way that a commercial wind or solar power system does.
Example Household Graph

The eGauge system designed for use in both households and commercial buildings. This figure shows a house with a 2 kW solar generation system together with its power usage over a period of one week. In this case, the owner is very "green". Their net power generated exceeds their usage, even though the sun only shines for a portion of each day. Such residential installations can help reduce fossil fuel usage greatly, although engineers and scientists must still solve the problem of storing energy for usage at later times. To see more graphs from businesses and industry throughout the country, click here.